Some training days flip you into the exact opposite role within a few hours. Today's program had two acts: first build the monitoring infrastructure, then investigate it. Two exercises, two skill sets, one platform at the center of both: Wazuh.
Wazuh, to set the scene, is an open-source SIEM: it centralizes logs from an entire fleet of machines, runs them through detection rules, and surfaces alerts ranked by severity. It's the equivalent of a control tower for an infrastructure. You just have to build it before you can sit inside it.
Act I — Deployment: standing up the monitoring MVP
The first exercise came with a very "real life" brief: the client has to meet compliance obligations (SOC2, ISO 27001) and wants to detect unauthorized access, suspicious file changes, and privilege escalations. The day's mission: deliver an MVP — a minimal but functional baseline — monitored by Wazuh.
Everything was set up in VMware, a hypervisor that lets you run several virtual machines and wire them together. The target topology came down to three building blocks:
wazuh-manager — the Ubuntu server hosting the SIEM backend and dashboard.
lab-server — an Ubuntu machine playing the role of a business server, fitted with a Wazuh agent.
Windows Desktop — a typical employee workstation, also running a Wazuh agent.
The principle is simple: install the manager, then deploy a lightweight agent on every machine to be monitored. The agent collects local events (logins, file integrity, system logs) and forwards them to the manager, which correlates them and raises alerts. Once both agents were registered and visible in the dashboard, the proof was there: logs were indeed flowing in.
To push a bit past the strict minimum, we added Suricata as an IDS/IPS on top — a network traffic inspection engine that detects known attack patterns and feeds its own alerts into Wazuh. A fun detail from the training: some of the test alerts carried the names of in-house scenarios, an easy way to check at a glance that the whole detection chain worked end to end.
Act I's lesson fits in one sentence: deploying a SIEM is mostly about wiring the pipes correctly. The hard part isn't the installation, it's making sure every agent talks to the manager and that the right events actually make it to the dashboard.
Act II — Investigation: becoming the analyst who reads the alerts
Hat change for the second exercise. This time the infrastructure already exists — pre-filled with several months of logs — and the mission is clear: investigate and check that nothing's off. You go from builder to SOC analyst.
First reflex, and first trap: the time window. The dashboard shows the last 24 hours by default, while the data to analyze ran from January to May 2025. Until the date picker is set to the right range — in the exact format, from 00:30:00 to 23:30:00 — the counters lie. I actually nearly signed off on a wrong count of 12 alerts simply because my bounds were off by a few hours.
All the work happened in the Threat Hunting module, querying the indexer with DQL. That's where the analyst's job becomes concrete: you filter, you sort, you expand a document to read its actual fields, and you piece together a story.
Counting the critical alerts
Counting critical alerts comes down to running a simple query and reading the total hits — definitely not multiplying the number of pages:
rule.level >= 15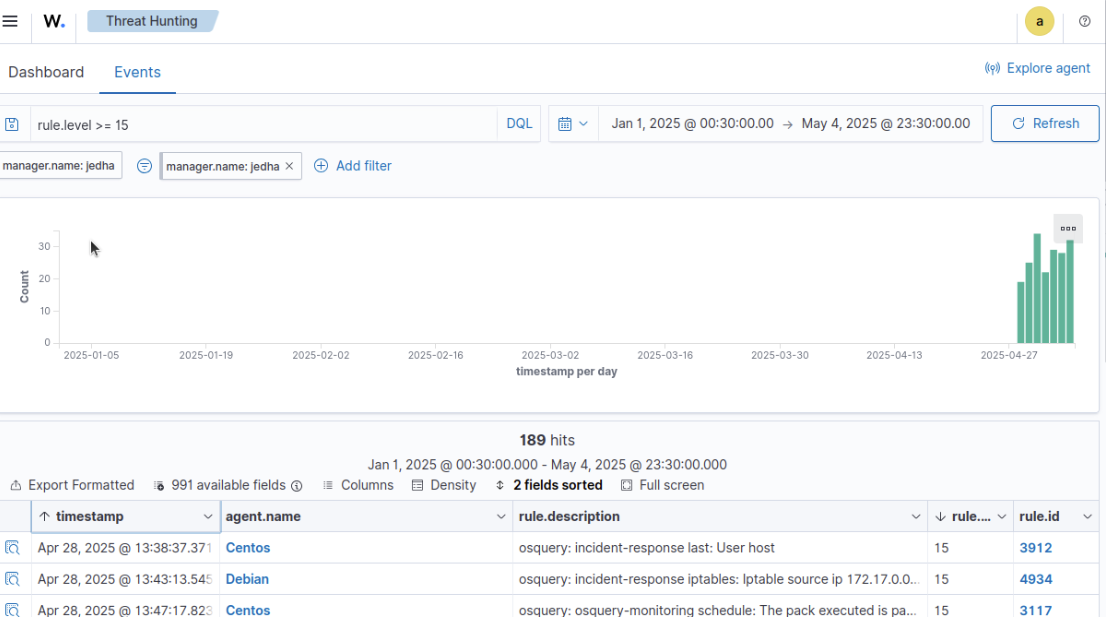
Result: 189 critical-level alerts (≥ 15) over the window from January 1 to May 4, 2025, and 2,400 high-level alerts (12–14). Two subtleties cost me — then saved me — time. First, a leftover filter "pill" rule.level: 7 to 11 was lingering under the search bar and combined with AND with my queries: asking for "level ≥ 15 AND level between 7 and 11" obviously returns zero results. Then, while searching for a log by its identifier, an ambiguous character — a lowercase l mistaken for a 1 — was enough to find nothing at all. The devil is in the typography.
Reading a sequence like a story
The heart of any investigation is correlation. On the Debian agent, a critical log flagged abnormally low memory. Searching for that specific log in Wazuh:

Looking at what happened right after on the same machine, a story took shape:

On May 2, 2025 at 13:48:17, osquery fires a critical alert (level 15): system memory is under 10%. One minute later, at 13:49:24, on the same host: sshd detects a suspicious connection attempt (scan). On top of that came another signal spotted earlier — a "possible breakin attempt" with an abnormal number of reverse-resolution errors — and above all a concentration of 41 connections coming from Spain, on agent 007 alone, within a single day. The pattern is textbook: repeated, massive SSH connection attempts from a single origin.
Memory maxing out, a burst of SSH scans, a single geolocation: three isolated clues that, strung together, tell the story of a brute-force attack.
On the MITRE ATT&CK side, this behavior falls squarely under technique T1110 — Brute Force (with, depending on the scenario, the Password Guessing sub-technique). That was the conclusion of the investigation.
Investigation summary
| Indicator | Value |
|---|---|
| Critical-level alerts (≥ 15) | 189 |
| High-level alerts (12–14) | 2,400 |
| First critical log | Apr 28 · 13:38:37 |
| Critical memory alert (Debian agent) | memory < 10% |
| Next event on the same host | sshd scan (1 min later) |
| Connections from the same foreign origin | 41 (agent 007) |
| Identified attack technique | T1110 — Brute Force |
What I take away: two sides of the same job
Chaining deployment and investigation in the same day changes how you see things. When you've wired the agents and tuned the rules yourself in the morning, you read the afternoon's alerts with a different kind of understanding: you know where each field comes from, why an event surfaces, and what a sensor's silence would actually mean.
Three reflexes will stick with me on any SIEM: the time window trumps everything (it's the first thing to check when a counter looks off); filters combine with AND, so one forgotten pill can silently skew everything; and above all, a single alert means nothing on its own — it's the sequence of events that tells the story of the attack. Low memory, then an SSH scan, then a burst of foreign connections: taken separately, noise; strung into a narrative, an intrusion.
Next steps: harden SSH exposure, automate blocking of abusive sources, switch over to key-based authentication. The watchtower is standing — now to reinforce the doors.
The environment's data is fictional.